
)
Evaluation of the chemical characteristics of a river system is a fundamental objective when assessing the ecological condition of a watershed. The chemical attributes of a river will not only affect designated uses established for the water resource (e.g. domestic, recreational, agricultural), but they will also influence what biotic assemblages inhabit stream reaches. Additionally, monitoring chemical characteristics along a stream can help identify impaired reaches and possible stressors, as well as monitor the effectiveness of restoration efforts.
Friends of Deer Creek/Sierra Streams Institute has been collecting and analyzing chemical water quality data since 2000 at more than a dozen sites in the Deer Creek watershed. A majority of the chemical data is collected in association with our citizen-based monthly water quality monitoring program.
We are monitoring the following water-quality parameters for Deer Creek:
- Turbidity. Turbidity is a measure of the amount of suspended particles in water. High turbidity is deleterious to many aquatic organisms and indicates excessive erosion in the watershed.
- Conductivity. Conductivity provides an estimate of the amount of salts dissolved in a water body. While some salt content is beneficial, high levels are harmful. An increase in conductivity beyond normal levels may indicate pollution from agricultural runoff or other sources.
- pH. pH is a measure of hydrogen ion concentration and indicates the relative acidity or alkalinity of water. pH significantly higher or lower than the neutral value of 7 is deleterious to most aquatic life. pH measurements outside of a certain range may indicate problems such as excessive decay of organic matter (eutrophication) or acid mine drainage.
- Nitrate (NO3). High nitrate content, typically from wastewater plant discharge and agricultural runoff, is problematic because it stimulates planktonic and algal growth, which can lead to eutrophication.
- Phosphate (PO4). Phosphate is similar to nitrate in terms of sources and effects.
- Dissolved oxygen. Oxygen is necessary for all forms of life. As dissolved oxygen levels in water drop below 5.0 mg/l, aquatic life is put under stress. Dissolved oxygen is reduced when excessive bacterial growth uses up the available oxygen.
- Total Coliform and E. coli bacteria. The concentrations of these indicator organisms can be used to assess the level of bacteria contamination in local waterways and the potential risk to humans recreating in these waterways.
- Water temperature. This is one of the most important parameters because of its influence on other water chemistry parameters such as dissolved oxygen levels, pH, rates of nutrient cycling, and contaminant transformation rates. Water temperature also regulates many aquatic organism functions including growth, reproduction, development, habitat preference, and competition.
Data for all these parameters are presented in several forms below.
Tabular Data
- Most recent complete water quality data: Measurements of all parameters at all sites from May 2001 to August 2009
- TAC-approved data: Measurements of all parameters at all sites from December 2000 to December 2006
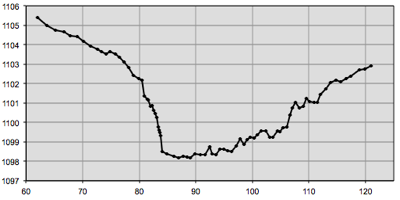
Graphed Data
- Annual changes overview: Graphs of all water quality monitoring parameters by site, as measured monthly from August 2008 to August 2009
- The bar-and-whisker graphs listed below aggregate all the monthly measurements for a specific parameter and provide statistical measurements of how these data have varied at each site. The red boxes in these graphs represent the inter-quartile range of the measurements (from the 25th to the 75th percentiles) and contain the median (shown as a black line); the whiskers on the boxes correspond to the 10th and 90th percentiles; and the green dots represent the 5th and 95th percentiles.
- Turbidity by site: Bar-and-whiskers graph of turbidity measurements at each site, as measured since 2000
- Conductivity by site: Bar-and-whiskers graph of conductivity measurements at each site, as measured since 2000
- pH by site: Bar-and-whiskers graph of pH measurements at each site, as measured since 2000
- Nitrate by site: Bar-and-whiskers graph of nitrate (NO3) measurements at each site, as measured since 2000
- Phosphate by site: Bar-and-whiskers graph of phosphate (PO4) measurements at each site, as measured since 2000
- Dissolved oxygen by site: Bar-and-whiskers graph of dissolved oxygen measurements at each site, as measured since 2000


)
)
)
)
)
)
)
)
)
)
)
)